| Situation Tracking
|
|
|
During the development of the VPS software and its
adaptation to the demands of the Central Command for Maritime
Emergencies, several operative components were incorporated into the
system. As examples, progress tracking and the drift model are
described on this site.
Progress tracking in the VPS-System is based on the continuous
recordings in the progress protocol and action logbook. In the
logbook, all activities and communications during routine
observations or during a pollution incident are stored.
The objects recorded in the progress protocol (ships, aircraft,
strike teams, etc.) are given the current coordinates via the GIS.
Thus, a geo-referenced progress protocol is established which offers,
using the tools of the VPS-System, among other things the following
data analyses:
|
- Display of the current progress as a table and in
GIS
- Display of progress at any time in the past
- Stepwise illustration in the GIS of progress changes
during any period of time
- Preparation of staff reports for any point of time
- Output of optimized progress reports as printed, or
mailable documents for different purposes
- Real-time information for connected users about the
current progress
- Saving of logbooks and situation reports in legal
certainty, because a subsequent editing of the entered
data is impossible
|
|
|
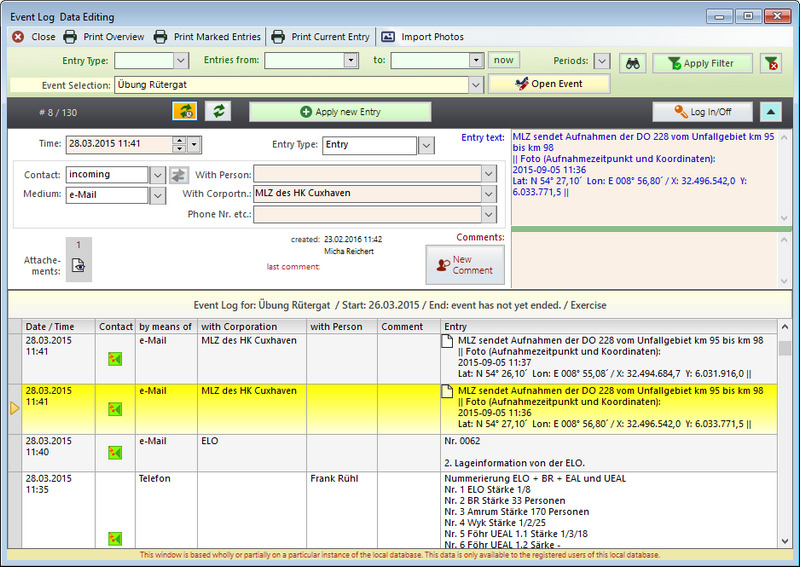
The following image shows the user surface of a logbook. |
|
|
In damage accounts, units and resources (devices, vehicles, materials) are managed and thus assigned to the
actually existing mission sections, staging areas or other rooms and locations. The structure and content of
the damage accounts are a model of reality in the area of operation, tailored to the needs of a command and control center.
This structure is also reflected on the user interfaces in VPS. system and allows a wide range of views and reporting options
based on the information stored in the loss accounts.
|
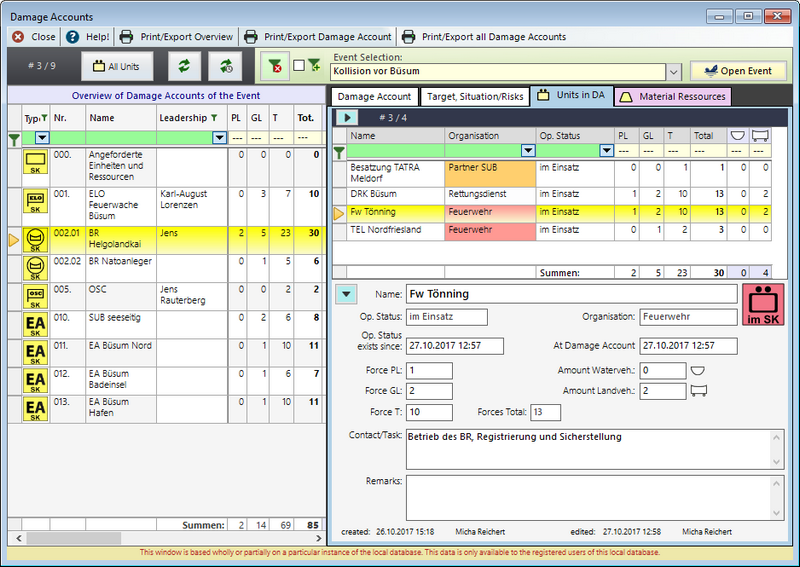
Every change to the damage accounts is automatically saved by the program in the situation log and thus remains traceable.
This storage in the situation log opens up a wide range of evaluation options, e. g. for the activity log of a unit or device
during an entire event - naturally only in the quality of data maintenance in the damage accounts.
Furthermore, the situation log can be filled manually with entries in order to record the position of certain means of
operation or objects (vessel involved in the accident, large equipment, dike sections, etc.) or states (weather situation, traffic situation, etc.).
|
|
|
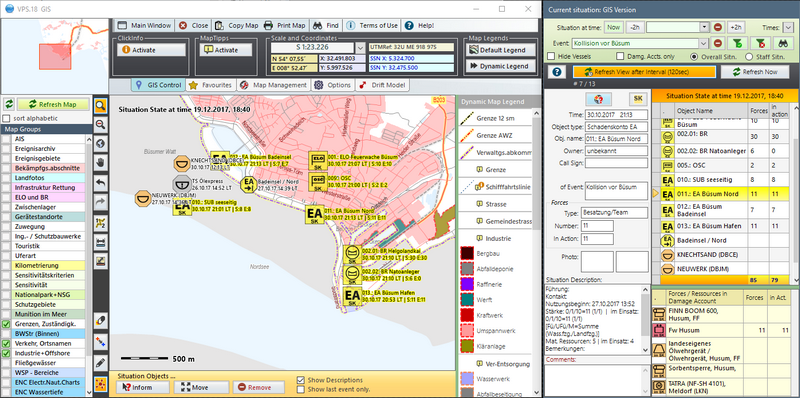
The evaluation of the situation report is
generated by the programme and displays the `current situation` at the current
point of time or at any desired point of time in the past as table or in the GIS: |
 |
Progress tracking in the VPS-System can do more than just replace the
traditional progress protocol and magnetic board with ship positions: through a
number of additional applications, the system provides transparency and
understanding of the local situation.
|
Into the GIS-window all situation objects appear at their the
displayed point of time in the corresponding position. In the window
`Current situation:GIS-version` adjacent to it, futher information
from the situation report is displayed. Both windows are linked and
allow the identification of situation objects on the map or the
localisation of situation objects from the list with the GIS.
The following image shows a map excerpt of the GIS in original size: |
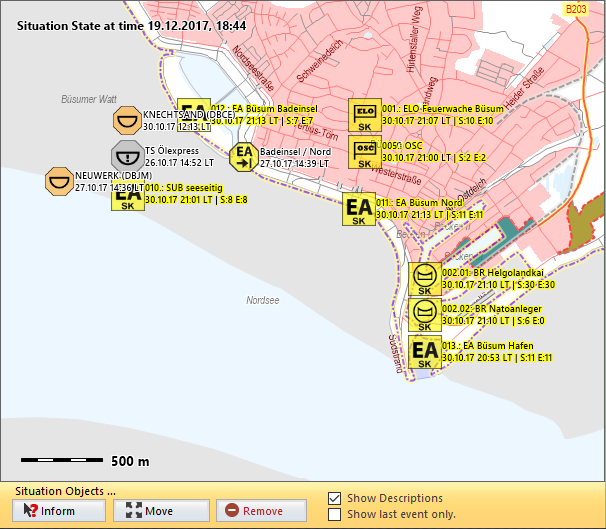 |
The button bar below the map enables the
identification of situation objects on the map by a click.
The button ´Move´ starts a drag&drop-menu for situation objects,
whereby they can be moved to a new position. A new situation report
entry will be automatically generated.
With the button ´Delete´, objects can be deleted from the situation
by a click, e.g. if they cease their operative work.
|
|
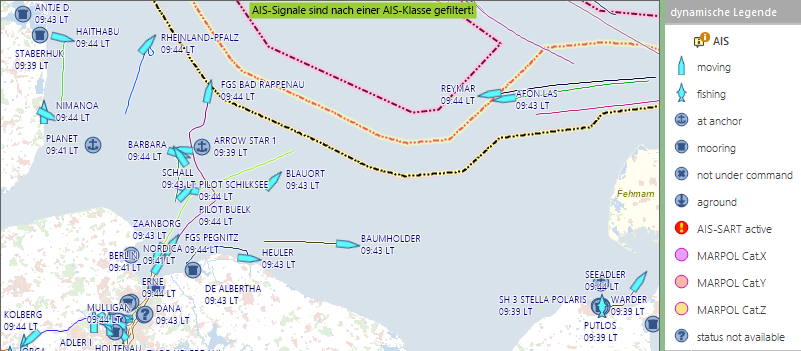
In addition to the display of the objects which are part of the current guided position, all other vessels with name,
direction of travel, navigation status and possibly dangerous goods load on board can also be shown on the map.
This data is based on AIS data retrieved every 2 minutes from a central server and displayed in VPS. GIS: |
 |
The movement data of ships determined on the basis of AIS data can also be automatically entered into the position report
in defined observation areas, e. g. around a ship accident, so that the shipping traffic in the accident area can be
archived in the position report without any manual effort.
|